
Students and Instructors
Brightspace Pulse – Dark mode for Android
Brightspace Pulse for Android now displays in Dark mode when Dark mode is enabled on your Android device. Using this mode can reduce eye strain and conserve battery power on your device.
Instructors Only
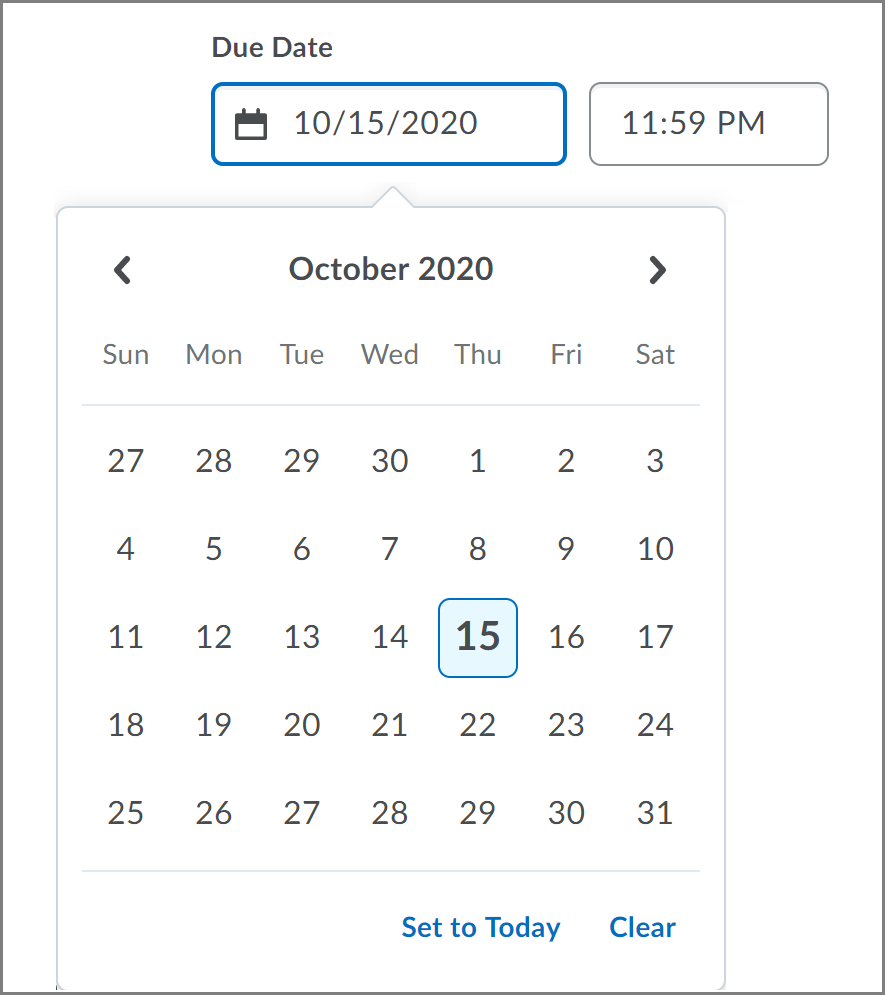
Dropbox – Date Picker Change
This feature updates the date picker component for the new Dropbox creation experience. The new date picker has a more streamlined design and requires a slight workflow change: to clear a date/time, the X alongside the time field has been replaced by a Clear option inside the calendar.
Grades – Display total points in Manage Grades
To improve usability of the Grades tool and reduce calculation errors, Manage Grades now includes total points for grade categories and Final Calculated Grade. Previously, there was no indicator of the total points while users were managing their grade book, and instructors were required to manually add up the points from all grade items to check if the total matched their syllabus.
For weighted grade books, the total weight is displayed in addition to the total points. For formula grade books, the manually-entered max points is displayed instead of the total points. Totals do not include bonus grade items and do support grade item dropping.
Insights – New version of the Engagement Dashboard
To increase the value of the Engagement dashboard, originally released in March 2019, this release updates and adds the following new features:
- The default setting for this feature is now Opt-in. Previously, the default setting was Off for the new Engagement Dashboard because clients had the previous version by default.
- By default, the most recently accessed 10 courses appear on the report; users can dynamically add or remove courses while interacting with the dashboard. There is a pop-up that appears when a user accesses the Engagement Dashboard that summarizes what is being shown in the default view.
- Grades appear as a bar chart. If you click on one or more bars, the dashboard filters the returned data for users and courses where the user has a grade in the selected range.
- Course Access appears as a bar chart. If you click one or more bars, the dashboard filters the returned data for the users and courses where the user has accessed a course in that time range.
- Time in Content appears as a scatterplot of the time in content compared to the current grade for each user in each course in view. If you click a quadrant, the dashboard filters on the users and their courses in that quadrant.
- Data points in the top left quadrant plot users that are getting an above average grade and spending below average time in the content.
- Data points in the top right quadrant plot users that are getting an above average grade and spending above average time in the content.
- Data points in the lower left quadrant plot users that are getting a below average grade and spending below average time in the content.
- Data points in the lower right quadrant plot users that are getting a below average grade and spending above average time in the content.
- The User Table below the dashboard includes the learners included in the cards above and dynamically updates as the dashboard is used. For example, if you click to filter on a bar in the Grades chart, the learners represented by that bar appear in the user table. Table columns include Name, Courses, Average Grade, Average Time in Content (minutes).
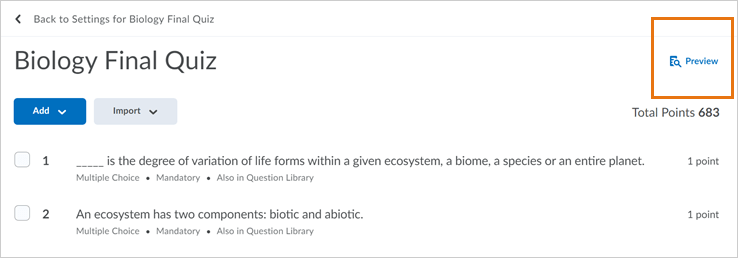
Quiz Builder – Quiz preview
Instructors can now view a preview of their quiz from Quiz Builder. Clicking the new Preview button on the Add/Edit Questions view of the quiz opens a quiz preview attempt in a new tab for a complete view of how the quiz appears to learners.
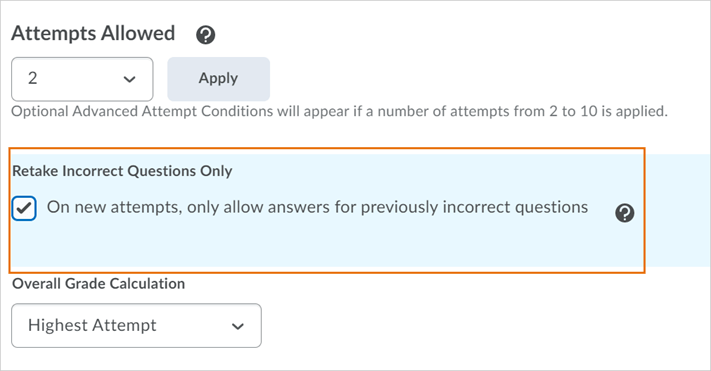
Quizzes – Retake incorrect questions in subsequent attempts
This feature introduces a new option for Quizzes Attempt settings that allows students to only retake their incorrectly answered questions from previous quiz attempts. Instructors can select this new option in the Assessment tab of a quiz. When the Retake Incorrect Questions Only check box is selected for subsequent quiz attempts, each learner only sees the questions they had previously answered incorrectly in the same order as the initial attempt (including quizzes with random sections and random questions). When grading a Retake Incorrect Questions Only quiz attempt, the instructor can only provide a score for the questions answered on this attempt.
A learner’s score for a Retake Incorrect Questions Only attempt remains at minimum, the score they had on the previous attempt. Correctly answered questions on the Retake Incorrect Questions Only attempt add to the learner’s attempts score. The Quiz Overall Score is calculated using the existing Highest/Lowest/First/Last/Average aggregation functions. The “Average” aggregation function can be used to give the student partial marks for questions that were not answered correctly on the first attempt.
Contact
If you have any questions about the updates, please contact CourseLink Support at:
courselink@uoguelph.ca
519-824-4120 ext. 56939